Museum of America in the Pandemic Year, 2020

Pick a SPECIFIC date to explore

Examination of Mainstream News Network Coverage of the Novel Coronavirus in Early 2020
-By Margaret Peacock, Jack Mittenthal, Lauren Tustison, and Erik L. Peterson

Could we have acted sooner? How many lives would we have saved if we had quarantined, closed the schools, and worn masks just two weeks earlier? These are questions that will haunt us for years to come. We know from previous pandemics that responding early to the threat can save lives. The first COVID-19 case in the United States was reported on January 15, 2020 in Washington State. On March 11, President Trump told the American public that the United States had the “best economy, the most advanced healthcare, and the most talented doctors, scientists, and researchers anywhere in the world” (Trump, 2020). That same day, the World Health Organization declared COVID-19 a pandemic. By March 16, 27 states and territories had closed their schools, with non-essential businesses following suit. 

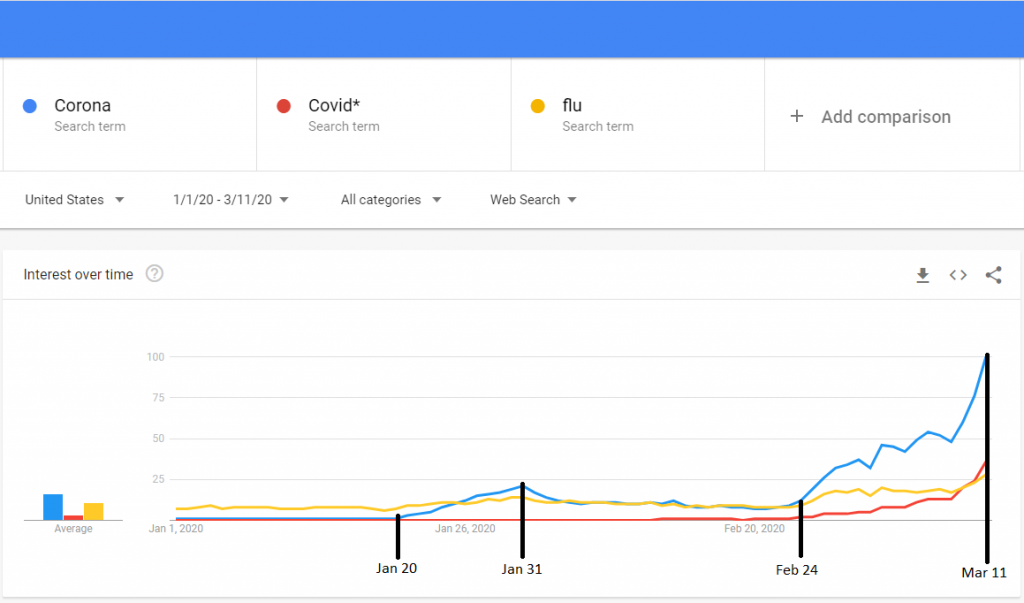
In the two months between the first COVID-19 case and the shutting down of the country, Americans paid surprisingly little attention to the rising threat. An examination of national Google searches made by Americans in these months finds that searches for the virus remained relatively low, beginning to make a statistical difference on January 20, peaking on January 31 with a score of 25-out-of-100 (with 100 representing a critical mass of widespread interest in a topic on Google), then dissipating until turning upwards again on February 24, finally peaking at 100 on March 11. When the NBA stopped its season on March 11, many Americans had given little to no thought to the proximal realities of the crisis. Many assumed it was a distant problem happening in China and Italy–an issue that American experts knew how to handle. At the same time, a dangerous counter-narrative that COVID-19 was a hoax orchestrated to bring down president Trump gained significant traction among a large group of conservative Americans. This disinformation encouraged listeners and viewers to ignore the warning signs of the pandemic. Disregarding the virus became a a test of one’s political loyalties and a way that people could perform their cultural identities in public. In addition, as the historian Charles Rosenberg has noted, societies are inclined to deny that an epidemic is happening early-on (Rosenberg, 1989). People have busy, precarious lives that would be disrupted by such an event, and they are loathe to incite panic. Only when the bodies start to accumulate do officials and general populations face up to what is happening. 

Epidemiologists agree that widespread public compliance with quarantining is the most critical component in addressing a pandemic. The best and only way to achieve this compliance is through effective messaging and information sharing (Merchant et all, 2020). Given that the general public in the United States was unprepared for quarantining and the realities of the threat in mid-March, was it because a failure in messaging occurred? If so, from whom? Scholars have already begun to tackle these questions. Some have levelled critiques at the CDC and the WHO. They released daily reports daily throughout January and February of 2020. And yet, as Holly Wilkin has noted, their messaging was often confusing and contradictory (Marquez, 2021). Others, ourselves included, have lodged searing critiques at the feet of Donald Trump and his supporters like Rush Limbaugh. While Trump refused to issue federal social distancing mandates or to wear masks, Limbaugh repeatedly told his 38 million listeners that the virus was a hoax. 

Insufficient attention has been paid, however to the role that mainstream media played in spreading awareness about the virus. The purpose of our research was to determine if the American media contributed to the relative ignorance of the American public towards the looming danger of COVID-19 in the first 68 days of 2020. Did they fail to cover the rising pandemic, or, was there something about their coverage that distracted us from the threat? 

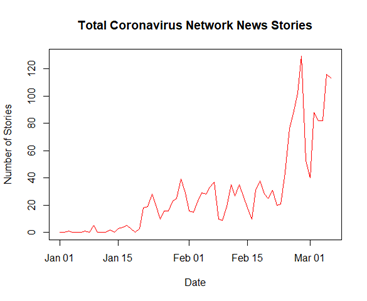
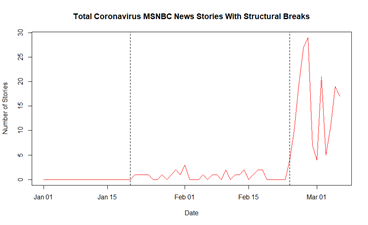
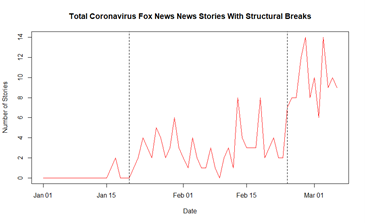
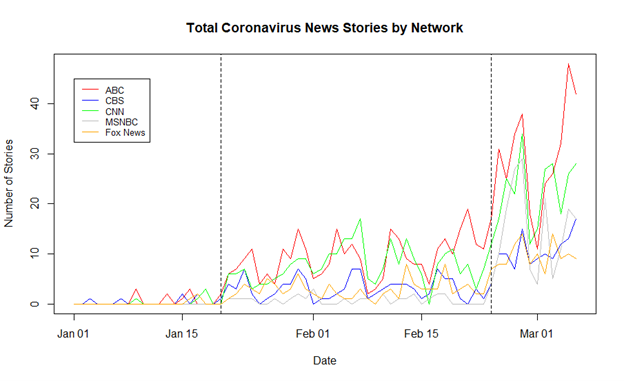
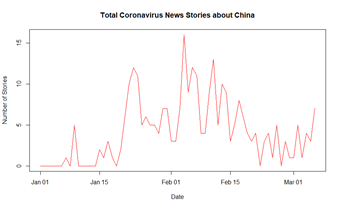
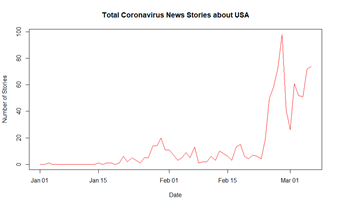
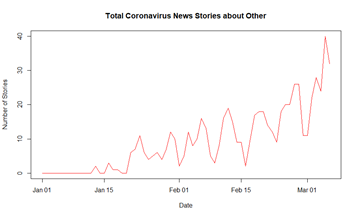
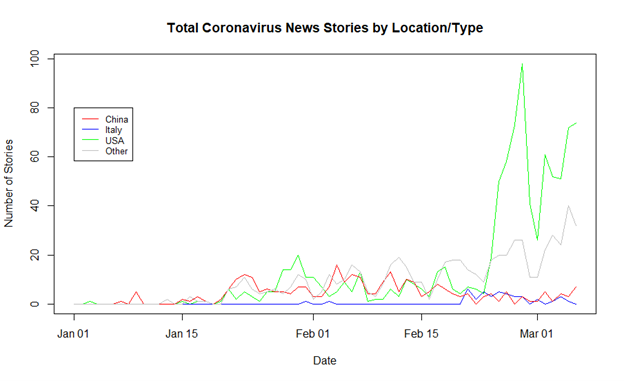
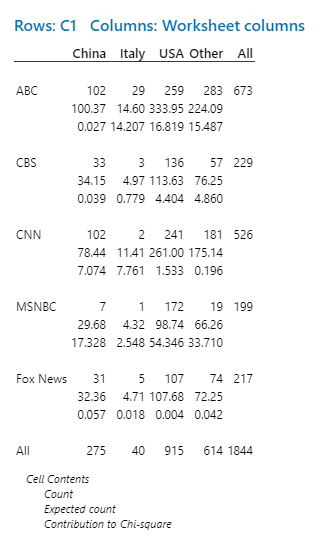
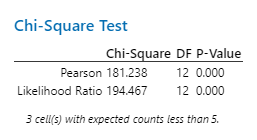
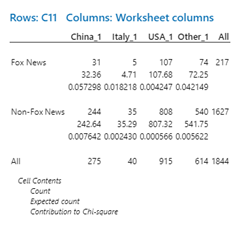
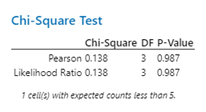
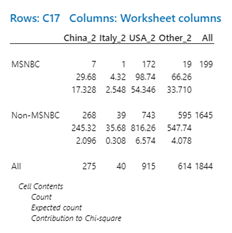
To answer these questions, our team of researchers set out to look closely at how the major American news networks (ABC, CBS, CNN, MSNBC, and Fox news) covered the novel coronavirus from January 1 to March 11, 2020. To do this, researchers downloaded every news story from the outlets’ archives and websites from these days into a large database that could handle natural language analysis. This included every printed story that was available through each outlets’ website. We then used inclusive, language algorithms to search through the database for stories related to the new coronavirus. Once those stories had been identified, we examined them individually to ensure that they dealt with the new coronavirus and to throw away any outliers. We identified 1844 stories in total. We then tagged those stories with the geographic region that they covered, sorting for stories on China, Italy, the United States, and a remaining catch-all category called “Other,” which included general messaging and the smaller number of stories related to other parts of the world. Our raw data can be seen here. 

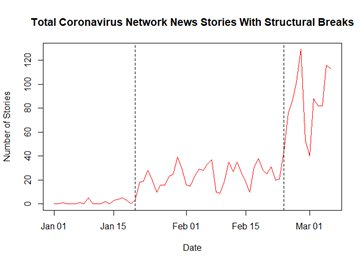
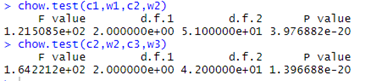
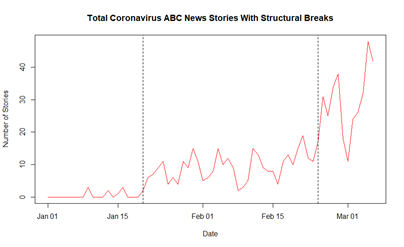
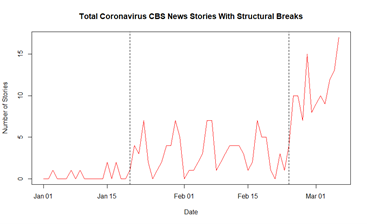
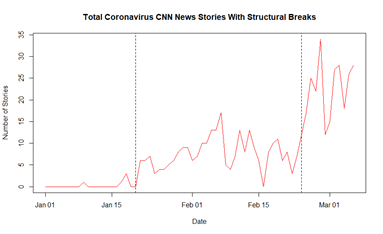
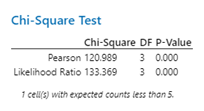
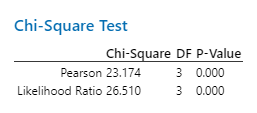
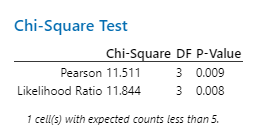
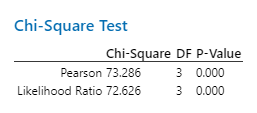
We asked two categories of questions of our data. The first related to the time and quantity of coverage given by the networks to the virus. This included understanding how much coverage of the novel coronavirus the networks provided. Did they differ from each other in their coverage? Were their moments when their level of coverage shifted, and if so, what were they? The second category of questions related to the types of stories that the networks recounted. Did the networks focus on different topics? Did watching one network over another indicate the kinds of stories one might read?  In other words, were the networks independent of the stories they told, or were they contingent? 


A Lull in American's Interest in the Novel Coronavirus: Jan 1, 2020 - March 11, 2020

A search on Google Trends, showing the relative interest in the the terms “Corona, Covid* and flu” from January 1, 2020 to March 11, 2020.

Quantity and Time of Coverage: Time Series Analysis

graph showing total stories covered by the networks

Our research reveals that there were two key moments when coverage of the virus shifted. 

A structural break in time series data refers to a point at which the trend in the data drastically changes. There are two obvious structural breaks above: one at January 21 and one at February 25. Those two dates are the dates at which Coronavirus coverage significantly increases for some time. These are the aggregated counts from all of the networks combined. See below for network-specific charts.

The R output shows the results for two different Chow Tests for structural breaks. The chow test evaluates a model based on two data sets split by the apparent structural break and a model based on the data combined and compares the effectiveness of each model. The first chow test is testing Jan 01 – Jan 20 data against Jan 21 – Feb 24 data to see if it is better modelled separately or together. We also included an indicator variable for whether or not it was a weekend since news stations release less on the weekend (accounting for most of the abrupt dips in the graphs). The second chow test does the same thing except it tests the middle section break with the last section break. Both tests produced incredibly large F statistics indicating that the data was better modelled separately at that point (confirming statistically what is clear from the first graph).


                     In other words, something really significant happened on January 20 and February 25 to make news cover it more heavily.

Below is the same analysis broken up by network

CBS Coverage
Fox news Coverage

An aggregate of all the networks plotted along a timeline:

Aggregate location coverage plotted ona timeline

All chow tests indicate structural breaks at the same points, but some structural breaks seem greater than others.

Next we set out to understand the causes of these breaks. We know that January 21 is around the time the first cases in Washington State appeared. February 25 more of a mystery. Below, we plot the geographic focus of the stories along a timeline:

Coverage on Italy plotted on a timeline

An aggregate of all geographic coverage, plotted along a timeline:

An aggregate of all locations plotted on a timeline

Summary of Time Series Analysis Findings:

Some preliminary conclusions can be drawn from these findings:

1- While we experienced a “lull” in our thinking about the novel coronavirus in February, there was no lull in press coverage. 

2- There were two key moments when Americans’ attention to the new coronavirus increased. The first correlates to the news of the first case in Washington State around January 21. We had initially hypothesized that the second spike in American attention to the virus was caused by news from Italy. This does not appear to be the case, however. Instead, it was news of the virus in the United States that spiked on February 25. This correlates with the debates on the Senate floor over emergency funding for the oncoming pandemic.

Type of Coverage: Contingency Analysis

In addition to tracking the total number of stories, we also kept track of the geographic focus of the stories, sorting for whether they talked about China, Italy, the United States, or some other topic or place, which we put into an “Other” category. The purpose of this inquiry was to determine if there was something unique about the networks’ coverage that shaped how we understood the news about COVID-19. 

We conducted a contingency analysis in order to see if the different networks payed attention to these geographic regions differently. We found that the networks did cover the virus differently, with Fox News standing out as the only network that was *not* unique in its coverage. With CNN and the other networks, you could predict what kinds of coverage you might receive (one might focus more on Italy while another would on the US). But with Fox News, their coverage was perfectly average and not likely to cover one place over another.  

First, we set out to determine if there was any reason to believe that the networks covered the regional outbreak of COVID-19 differently from the rest…

Graph showing the number of stories on coronavirus covered by each network and the geographic focus of each story

The purpose of the contingency analysis is to determine if the variables are independent. In other words, does each network report on the countries in the same way, or, are they doing something unique from the others? To test this, independence is given as the null hypothesis (meaning that no statistical significance exists between the particular network and the locations that they cover in their stories), and the expected number of stories for each cell is calculated to be (row total + column total) / grand total. The sum of the squared differences between the observed and expected values divided by the expected value ((observed – expected)2 / expected) follows a chi-square distribution. The chi-square value found is sufficiently large to reject the null hypothesis of independence, meaning each network does not report on the countries in the same way. To see where the significant discrepencies are, different Contingency Analyses can be performed that isolate each network:

Isolating Fox News
Isolating Fox News from the other networks
A Chi-square test on the isolated Fox News variable
Isolating MSNBC
Isolating CNN
Chi-square test on isolated CNN
Isolating CBS
Isolated CBS stories
Chi-square test on CBS stories
Isolating ABC
Isolating ABC stories
Chi square test on ABC stories

The five above contingency analyses test for independence like the first. However, they are broken up to be network specific. Thus, each answer the question: “does X network publish stories independent of location/type?” (Here is a good point to mention that “Other” not only includes other countries, but also general coronavirus PSAs and such not tied to a specific location). All the tests above reject the null hypothesis of independence except for the Fox News test. This means that the only time locations were reported on independent of the network was with Fox News.

* We considered that perhaps, because MSNBC only posted to their website when it came from a clip on their television show, we should remove their data to see if the numbers changed significantly. They did not. Fox news remains the only network that failed to reject the null hypothesis of independence.

Summary of Contingency Analysis Findings

  • When all networks and all types of stories are included, the only network that reports stories independently of the location/type is Fox News
  • ABC is the only network that effectively reported any Italy stories.
  • MSNBC only uploaded clips from network TV, which was aimed at US viewers and had to take on a narrow scope to fit into a one hour time slot. Thus, they effectively only reported US stories
  • When ignoring MSNBC and Italy data altogether (because MSNBC’s sample size and general coverage of Italy is small):
    • CNN and Fox News report on stories independently of location
    • Every network reports on China to the same relative degree
    • CBS has a disproportionately high amount of USA stories and low amount of Other stories, while the opposite is true for ABC
0 Shares